This week I worked on some interesting stuff and fortunately there was a cool learning outcome from it, which is worth a blogpost, so I summarize it here.
This was an ASP.NET MVC application in a sector which begins with 'b' and ends with 'anking' (As you see I don't share confidential information about customers! ;) ). The application was running on a powerful server with 32GB ram, but the problem was that it ran out of memory after a few hours. I had a memory dump, which was already ~12Gb.
The first I thought was of course: Memory leak! So I opened WinDbg and started the investigation to prove this. First I concentrated on unmanaged stuff and used the !heap -s command to see the heaps. There was one with more than 8Gb, so I thought: ok, there must be something interesting there! I used the !heap -stat -h to see the distribution of the allocated objects. This showed something like this:
0:000> !heap -stat -h 0000000000190000
 heap @ 0000000000190000
group-by: TOTSIZE max-display: 20
    size     #blocks     total     ( %) (percent of total busy bytes)
    bff00 2 - 17fe00  (8.62)
    93aae 1 - 93aae  (3.31)
    88840 1 - 88840  (3.06)
    88828 1 - 88828  (3.06)
    8553c 1 - 8553c  (2.99)
    85524 1 - 85524  (2.99)
    80558 1 - 80558  (2.88)
    6444c 1 - 6444c  (2.25)
    62276 1 - 62276  (2.20)
    5ff40 1 - 5ff40  (2.15)
    56ac8 1 - 56ac8  (1.95)
    52418 1 - 52418  (1.85)
Ok, so this is definitely not a memory leak. The most allocated type takes up 8.62% of all the allocated stuff on this heap...if this would be a memory leak this would be something above 90%. I did not give up on this path: I wanted to see the same for managed code.
The distribution of the managed objects was also fine:
- System.String - 422mb (there may be potential for optimization, but for such a big application it is nothing which would kill that server),
- System.Byte[] - 298mb
- System.Char[] - 242mb
So I did not see this classical "hold a reference for a managed object forever" pattern. (Most people also call this managed memory leak, which in my opinion is a completely wrong term... some years ago I could yell at people using this, today I accept it... this is maybe a sign that I get older).
Ok, so next step: what else can that be? I thought... Ok, let's see what about appdomains. I used the !dumpdomain command.
This command not only lists the appdomains, but also all the assemblies loaded for every appdomain. This took about 10 minutes to finish, because WinDbg printed out so much stuff. There was only one appdomain used by the application, and there were already more than !!100.000!! assemblies loaded into it, and most of them were dynamically generated assemblies. After this it was obvious that these dynamically generated assemblies are the root cause of the problem.
The next step was to figure out what generates these assemblies. First I tried to use the !SaveModule command, but that does not work with dynamically generated assemblies. But google helped me:
There is a great StackOverflow answer here. In short:
There is the !DumpModule -mt [moduleaddr.] command which prints the typedefs in the module and then there is the !DumpMt -md [typeaddr.] command which prints the method table for a given type. Both of them work also for dynamic assemblies.
Here I saw methods like this:
Microsoft.Xml.Serialization.GeneratedAssembly.
      XmlSerializationWriter****.***(System.Object)
Ok, so something with XML serialization! I asked other colleagues if they knew something about it, and I got a hot tip: this must be the evil XmlSerializer class. Here is a what msdn says:
"To increase performance, the XML serialization infrastructure dynamically generates assemblies to serialize and deserialize specified types. The infrastructure finds and reuses those assemblies. This behavior occurs only when using the following constructors:
XmlSerializer.XmlSerializer(Type)
XmlSerializer.XmlSerializer(Type, String)
If you use any of the other constructors, multiple versions of the same assembly are generated and never unloaded, which results in a memory leak and poor performance." *(I don't start now the discussion about the definition of a memory leak...)
Bamm, that's it! Since I already stored the assemblies of the application (not the dynamic assemblies... only the ones with framework+application code) I opened them immediately with ILSpy and looked for XmlSerializer. The application used everywhere one of the two mentioned constructor overload, except in one class. And that was the one causing the problem.
The fascinating part of the whole story for me was not that there are overloads of the XmlSerializer constructor which cause this terrible behavior (it's documented anyway), much rather the fact that you can find these kinds of things very easily with WinDbg.
Here is a simple application to simulate the problem:
namespace XmlSerializerMemIssueReproducer
{
    public class SampleClassToSerialize
    {
        public string StringProp { get; set; }
        public int IntProp { get; set; }
    }

    class Program
    {
        static void Main(string[] args)
        {
            Console.WriteLine("Press any key to start");
            Console.ReadKey();

            TextWriter writer = new StreamWriter("serialized", true);

            //Let's say this for loop simulates incoming
            //HTTP requests in an ASP.NET application
            //meaning every request creates a new serializer
            for (int i = 0; i < 100; i++)
            {
                var serializer = new XmlSerializer(
                    typeof(SampleClassToSerialize),
                    new Type[] { typeof(String) });
                var itemToSerialize = new SampleClassToSerialize
                { StringProp = "Str", IntProp = 42 };

                serializer.Serialize(writer, itemToSerialize);
                Console.WriteLine
                    ("Serialized, press any key to do the next one");
                Console.ReadKey();
            }
        }
    }
}
Here is a screenshot from PerfMon which plots the Total Assemblies performance counter for the process.
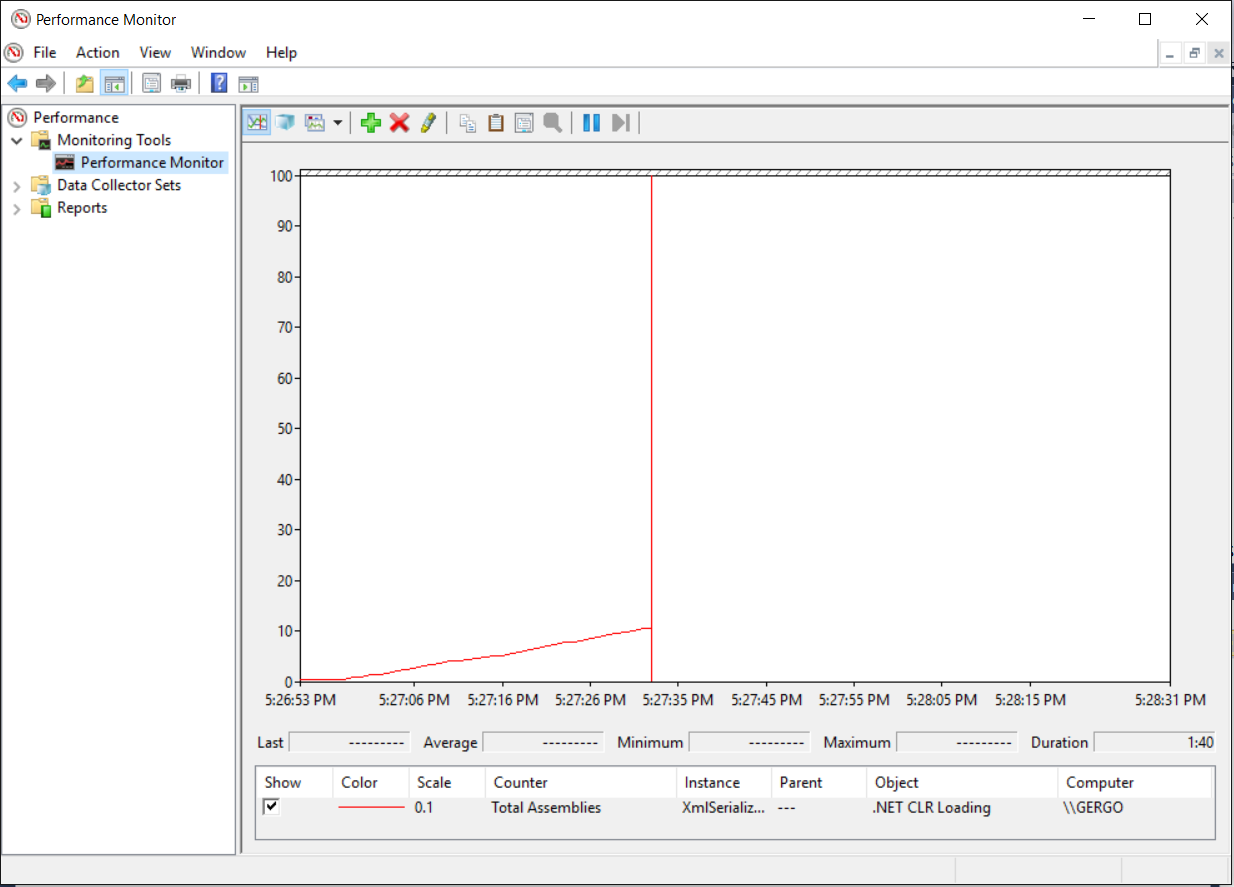
As you see the XmlSerializer creates an assembly in every round (in the production code it was for every incoming http request). As you know assemblies cannot be unloaded, only appdomains, but these assemblies are loaded into the main appdomain of the application, so they stick there until the process lives (which was a very short time range in production).
So, learning outcome:
- The XmlSerialize class is evil! Use it very carefully!
- With the DumpModule and DumpMt commands you can figure out basically everything about a dynamically generated assembly
Cheers,
Gergö